

- Track Resource Utilization: View comprehensive cluster usage data, including ecores consumed over specific timeframes.
- Analyse Cost Trends: Understand the financial implications of your cluster usage with detailed cost breakdowns, enabling better budgeting and cost control.
- Make Informed Decisions: Use the provided statistics and analytics to fine-tune your operations, ensuring efficient resource allocation and minimizing unnecessary expenditure.

This metric shows the cumulative cost incurred from using ecores (a unit of computing resources) during the selected period. It helps you track the financial expenditure related to your cluster’s operation. Total ecores Consumed:
This value represents the total number of ecores consumed by your clusters. It provides insight into how much computational capacity has been utilized over time. Average Daily Cost of Used ecores:
This figure indicates the average daily cost for the ecores used during the specified period. It helps you understand the typical daily expenditure associated with running the clusters. Average Daily ecores Consumed:
This metric shows the average number of ecores consumed daily, helping you monitor and manage your resource usage over time. Exporting Data as a CSV File
- Navigate to the Usage and Cost section.
- Select the desired date range.
- Click the Export CSV button.
- Download the CSV file containing the data.
- Use the exported file for offline analysis, reporting, or to share with others.
- Monitor usage, costs, and resource allocation over time using the overview and export features.
Usage
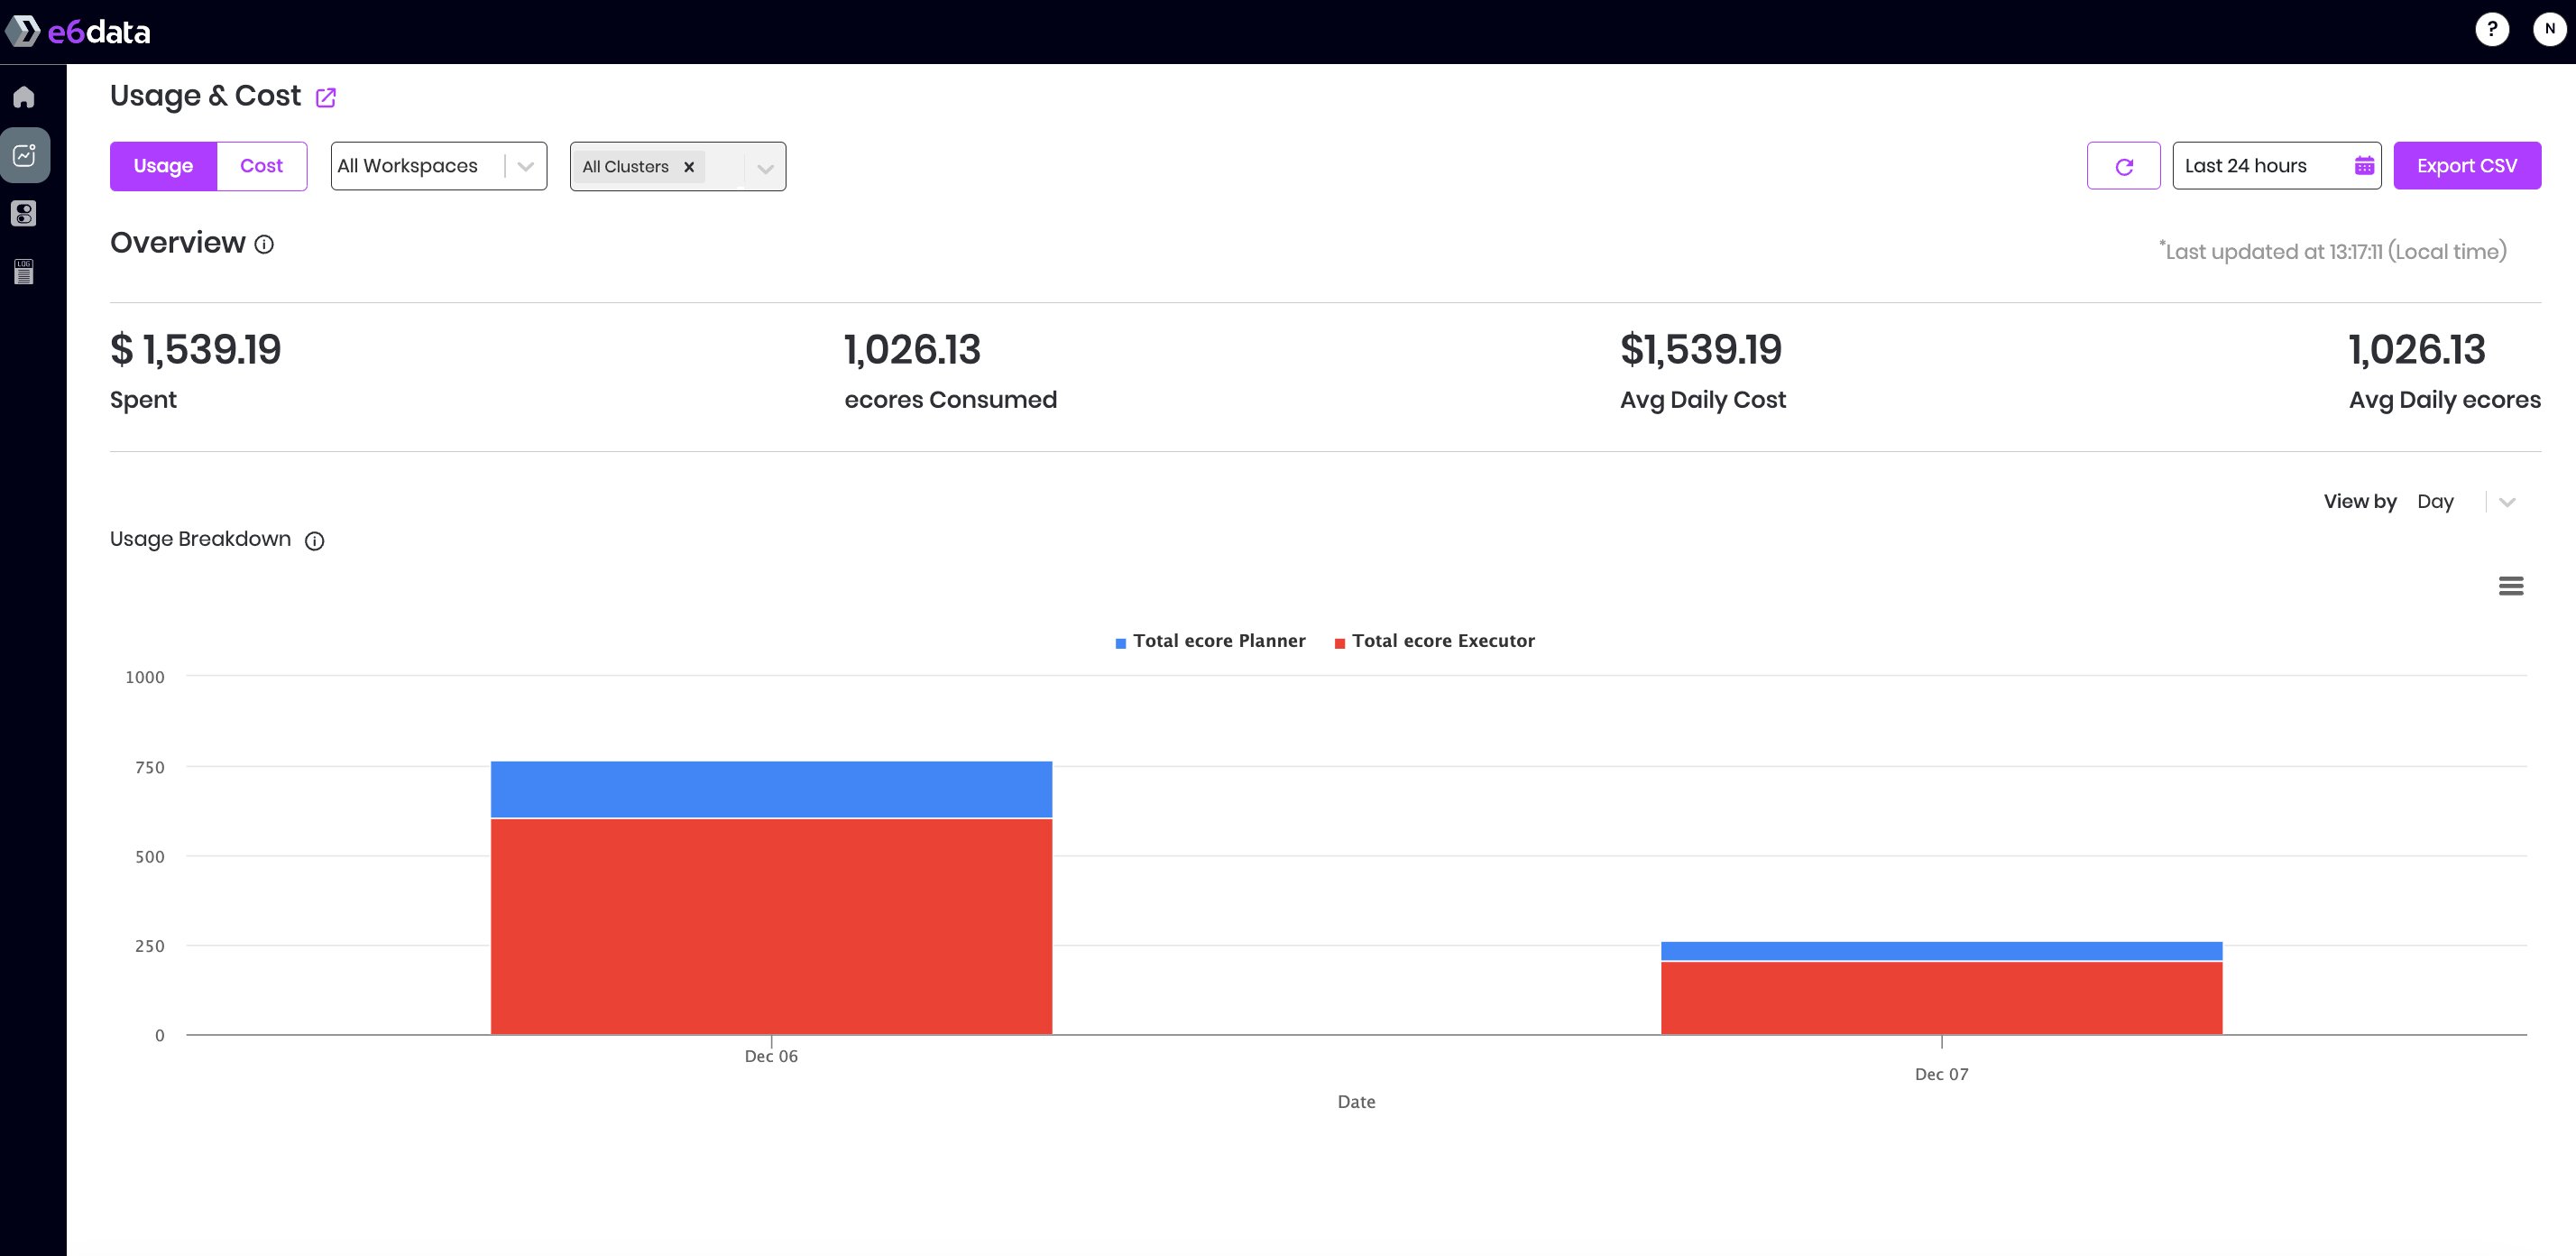
Note: Access to the Usage and Cost pane requires the Billing Manager role.
- Navigate to Usage and Cost in the left navigation panel.
- Under Usage, choose the desired date range (default: last 24 hours).
- Select the workspace from the drop-down menu.
- Choose the cluster(s) within the selected workspace.
- Select Day for daily usage or Hour for hourly usage from the drop-down menu.
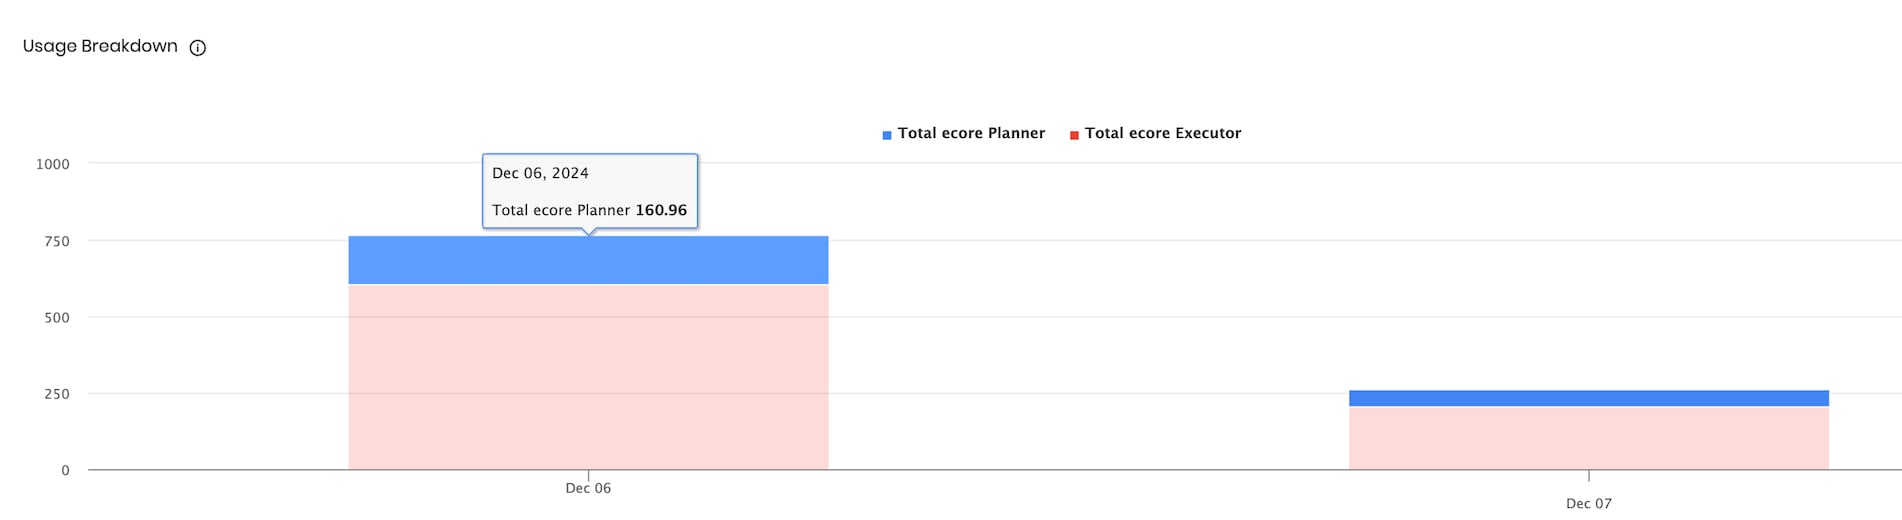
The bar graph provides a detailed representation of ecores usage for each cluster, breaking down the consumption into two key components: planner and executor. This visualization allows users to analyze and compare resource utilization across clusters, offering valuable insights into the specific functions driving ecores consumption.
Cost
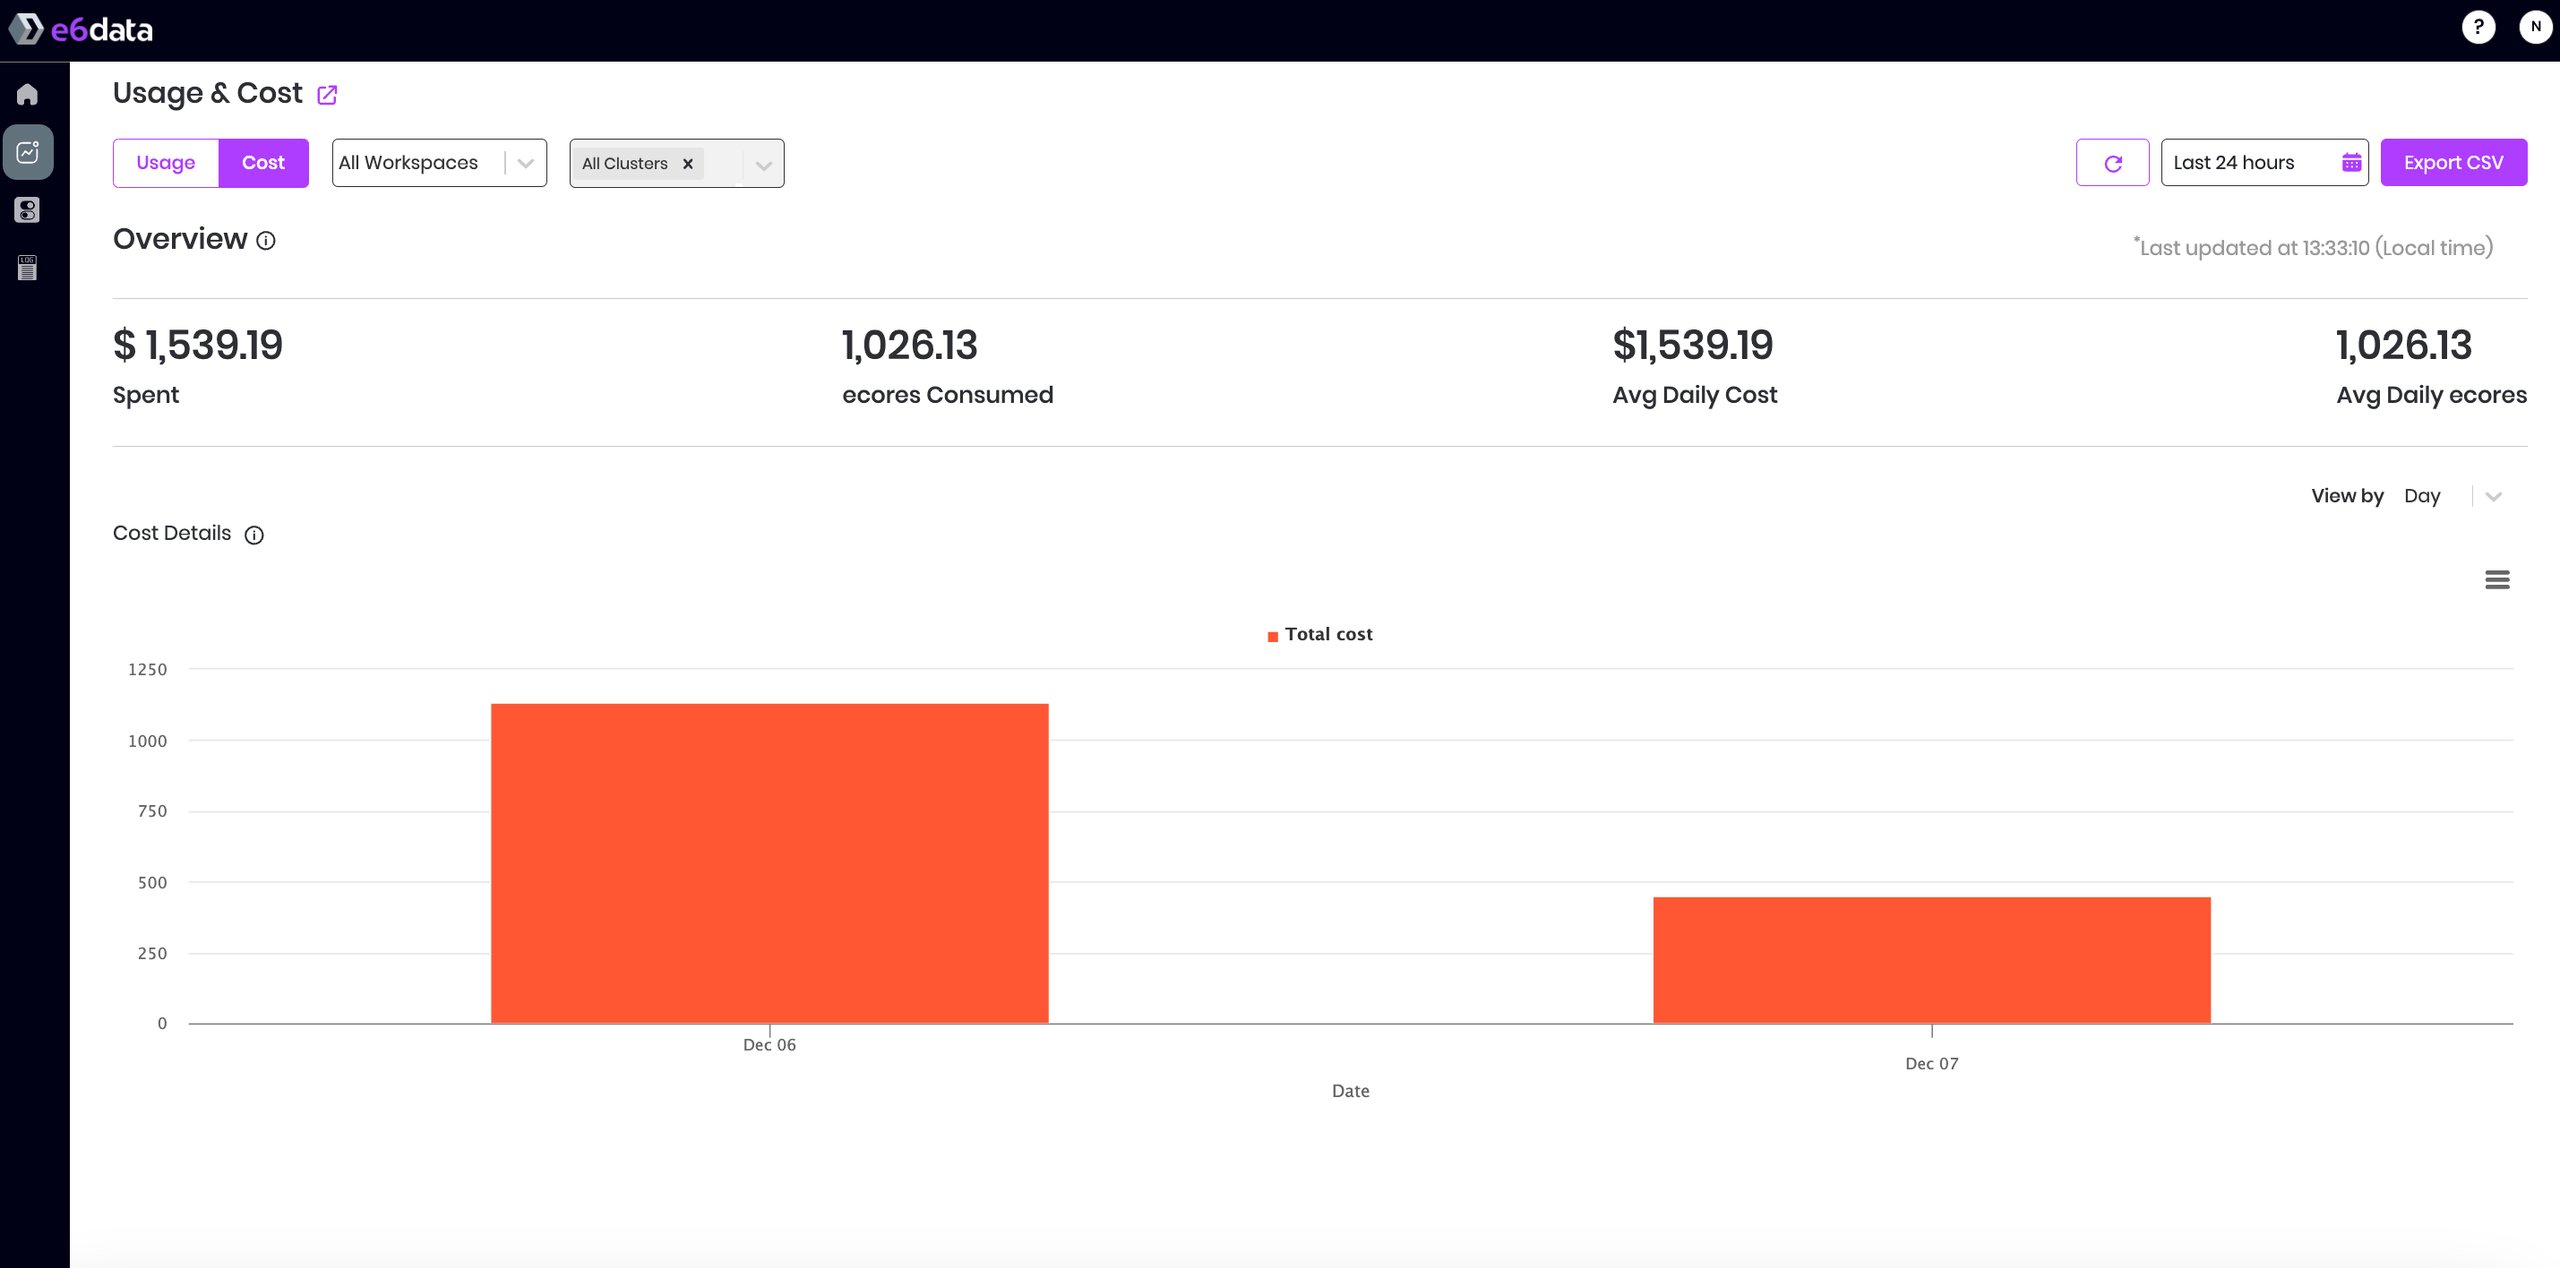
Note: Access to the Usage and Cost pane requires the Billing Manager role.
- Navigate to Usage and Cost from the left navigation panel.
- Under Billing, choose the desired date range (default: last day).
- Select the workspace from the drop-down menu.
- Choose the cluster(s) within the selected workspace.
- Select Day for daily billing or Hour for hourly billing from the drop-down menu.
How Are Costs Incurred?
The total cost of using e6data is determined by the cumulative usage of ecores. Example: Total Cost for One Week Scenario: An organization uses 3 e6data clusters daily for 5 days a week, each running for 8 hours (9 am to 5 pm).- Cluster Size: XS (Cluster sizing)
- Total ecores per Cluster: 38
Note: Cluster configurations can vary based on individual customer requirements.
Total cost = 3 (No of clusters) * 38 (ecores per cluster) * 8 (Hours per day) * 5 (Days per week) * Cost factor Total Cost: 4560 * (Cost Factor)
Data is updated and recorded at the start of each hour (e.g., 1:00 AM, 2:00 AM, etc.) in Coordinated Universal Time (UTC), ensuring consistent and accurate hourly tracking.